Etsy Shop Stats Analytics Guide: How to Read Data and Grow Sales
Staring at your Etsy dashboard feeling confused by the numbers? Guessing what works leads to wasted time and lost sales. Learn exactly how to read your data and turn insights into a highly profitable print-on-demand business.

Bullet Points (TL;DR)
Etsy stats provide crucial data on impressions, views, visits, and conversion rates to measure shop performance.
The Search Visibility Dashboard shows how often your listings appear in search and helps you optimize tags and titles.
Regularly tracking sales and traffic sources allows you to identify trends and make data-driven marketing decisions.
Understanding customer behavior through analytics helps you tailor your listings to increase sales and grow your Etsy shop.
Looking at your Etsy dashboard for the first time can feel like trying to read a foreign language. You see lines moving up and down, green arrows, red arrows, and a sea of numbers. You might have 500 views one day and 50 the next. You might see a spike in traffic but hear absolute silence from your cash register.
This confusion is exactly where most print-on-demand sellers get stuck. They create products, list them, and then cross their fingers, hoping the algorithm will magically favor them. But hope is not a business strategy. When you do not understand your numbers, you make blind decisions. You might spend hours changing tags on a product that actually has a photo problem, or you might lower the price of an item that simply needs better keywords.
Data is only useful if it leads to clear, confident action. Reading your Etsy shop stats is not about becoming a math expert. It is about listening to what your customers are trying to tell you. Every click, every favorite, and every bounce is a piece of feedback.
In this complete guide, we will break down exactly how to read your Etsy Shop Stats panel. We will explain the vital differences between confusing metrics, show you how to track your real traffic sources, and give you a clear action schema. By the end of this read, you will know exactly what to do when a metric changes.
The Foundation: How to Read Your Etsy Shop Stats Panel
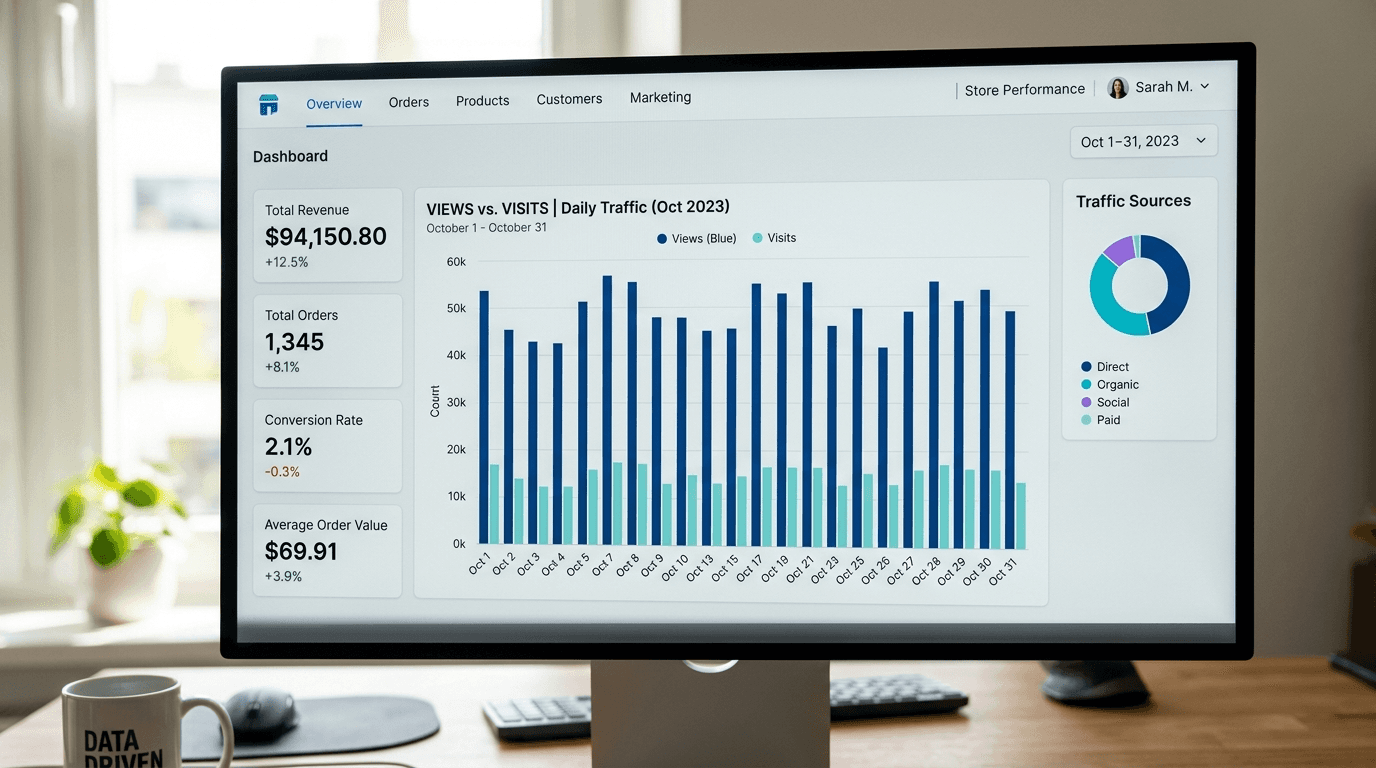
Before you can make high-level decisions, you need to know where to look. When you log into your Shop Manager and click on "Stats," you are greeted with an overview of your shop's recent performance.
By default, Etsy shows you data for the last 30 days. While this is a good quick check, it is often misleading. E-commerce is highly seasonal. Comparing your sales in July to your sales in November will always make you feel like you are failing in the summer or acting like a genius in the winter.
To get a true read on your business health, you must change the date range to compare "Year over Year." If you are in October 2026, compare it to October 2025. This tells you if your baseline business is actually growing or if you are just riding a normal seasonal wave. If you are a brand new seller without a year of data, stick to 30-day windows but keep major holidays in mind.
Always look at your data in at least 30-day chunks. Daily numbers fluctuate wildly based on the day of the week, weather, and minor algorithm tests. Do not panic over a slow Tuesday.
Your main dashboard highlights four key numbers: Visits, Views, Orders, and Revenue. Many sellers obsess over Revenue. While Revenue pays the bills, it is a "lagging indicator." This means it is the final result of things that happened earlier. To change your Revenue, you must focus on the "leading indicators": your Visits and your Orders.

Decoding the Metrics: Views vs. Visits Difference Explained
This is the most common point of confusion for Etsy sellers. What is the difference between a view and a visit? Understanding this relationship is the secret to keeping people in your shop longer.
What is a Visit?
A "Visit" represents a single person browsing your shop or your listings. Think of your Etsy shop as a physical retail store. A Visit is counted when a customer walks through the front door. Whether they stay for ten seconds or ten minutes, it counts as one Visit. If they leave and come back three hours later, that is a new Visit.
What is a View?
A "View" represents how many individual items that person looked at. Continuing the physical store example, if a customer walks in (one Visit) and picks up three different t-shirts to look at the details, that generates three Views.
The Views to Visits Ratio
The magic hides in the relationship between these two numbers. You want your Views to always be higher than your Visits.
If you have 100 Visits and 100 Views, your ratio is 1:1. This is a warning sign. It means 100 people walked into your store, looked at the exact item they clicked on, and immediately walked out. They did not browse. They did not check your other colors. They bounced.
If you have 100 Visits and 350 Views, your ratio is 3.5:1. This is fantastic. It means the average person is looking at three or four different items before leaving. They are highly engaged with your brand.
How do you fix a 1:1 ratio? You need to give them a reason to keep clicking. This is where smart product grouping comes in. Instead of having separate listings for a t-shirt, a hoodie, and a mug with the same design, you can use Combo Listings. This Listybox feature allows you to combine multiple product types into one single Etsy listing. The customer clicks for the t-shirt, sees they can also get the mug from the dropdown menu, and stays engaged. This keeps your momentum high and saves you money on listing fees.
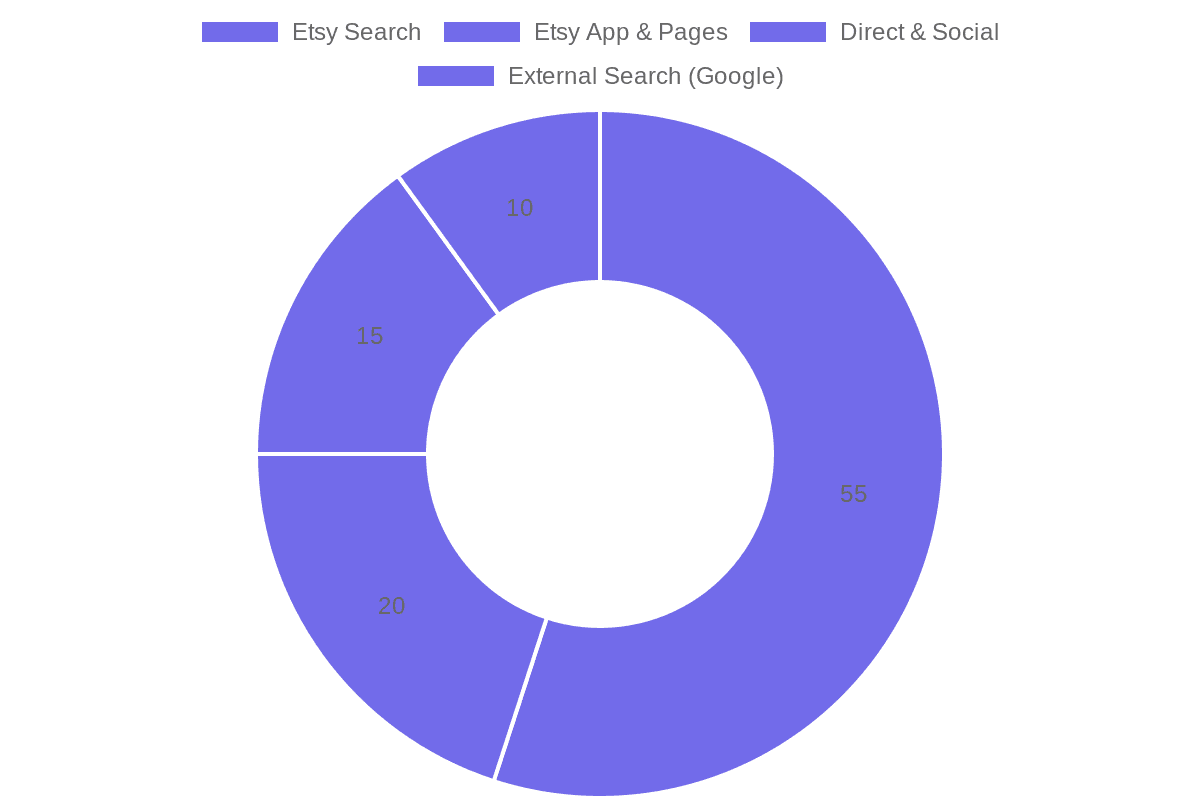
Tracking Your Traffic Sources: Where Are Your Buyers Coming From?
Not all traffic is created equal. 100 visits from your mom's Facebook page will behave very differently than 100 visits from someone actively searching for a "custom dog mom sweater" on Etsy.
Scroll down your Stats page to find the "How shoppers found you" section. This breakdown tells you exactly where you should spend your time and energy.
Etsy App & Other Etsy Pages
This includes traffic from people browsing the Etsy app, clicking on Editors' Picks, or finding you through their personalized home feed. High traffic here means the Etsy algorithm trusts your shop. It means you have good reviews, ship on time, and have a history of making sales.
Etsy Search
This is the lifeblood of a passive income business. This number represents people who typed a specific phrase into the Etsy search bar and clicked on your item. If this number is low, your SEO (Search Engine Optimization) is failing.
Fixing this manually requires hours of keyword research and guessing. Instead of struggling, you can use Listybox's Magic Wand SEO tool. With a single click, our fine-tuned AI engine analyzes actual market data to write highly relevant titles, 13 perfect tags, and sales-driven descriptions. It does the heavy lifting so you can capture organic search traffic. For a deeper dive into ranking, read our complete Etsy SEO guide.
Direct & Other Outside Traffic
This traffic comes from people typing your shop URL directly into their browser, clicking a link in an email, or coming from your social media accounts like Instagram or TikTok. If you are actively promoting your shop on social media, this is where you measure your success.
Etsy Ads
If you are paying for Etsy Ads, this tracks the visits generated by your budget. Always compare your ad spend to the revenue generated here to ensure you are actually making a profit, not just buying empty traffic.
According to industry data, shops that rank on the first page of Etsy search receive up to 80% of their total traffic organically, completely free of charge.
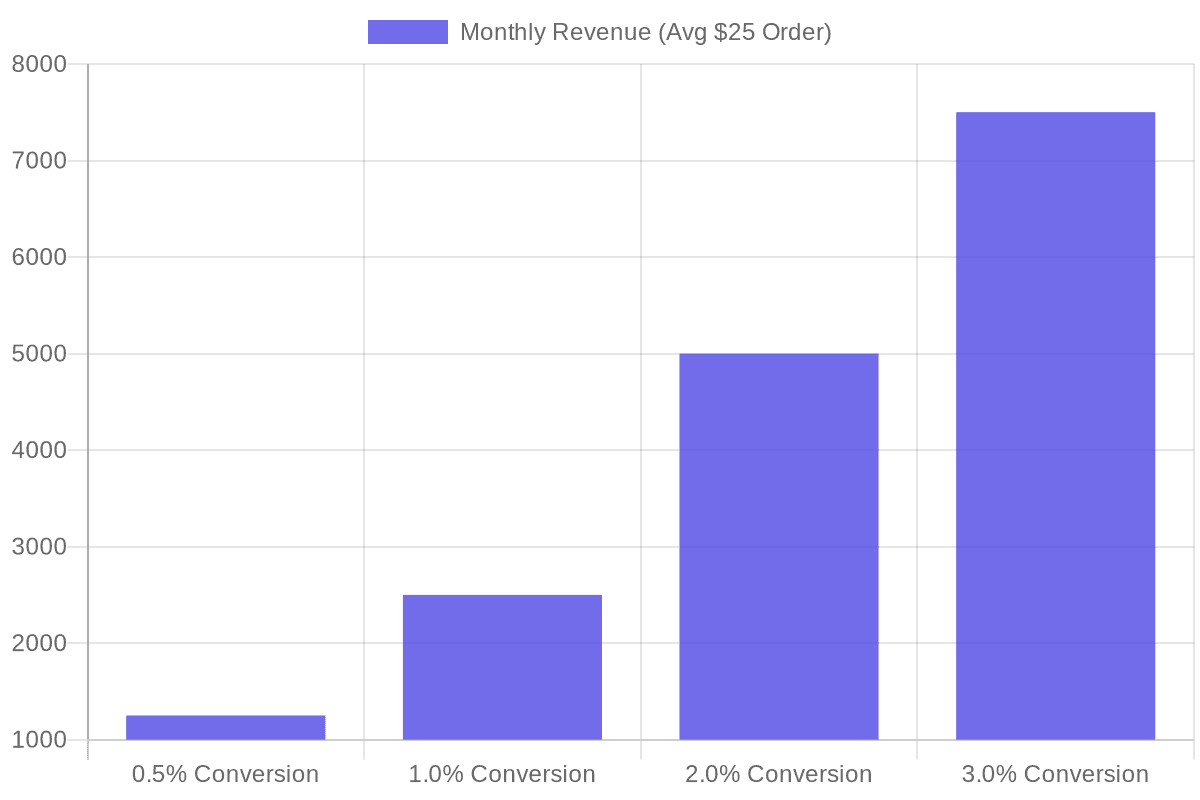
The Golden Metric: Conversion Rate Tracking
If you only look at one number in your entire dashboard, make it your Conversion Rate.
Your conversion rate answers a simple question: Out of every 100 people who visit my shop, how many actually buy something?
The formula is simple: (Orders / Visits) * 100.
For example, if you had 1,000 visits last month and 20 orders, your conversion rate is 2%.
Why is this the golden metric? Because Etsy is a business. Etsy makes money when you make money. The Etsy algorithm actively monitors your conversion rate. If you get 5,000 visits but zero sales, the algorithm assumes your product is terrible or misleading. It will quickly drop you from the search results.
Conversely, if you get 100 visits and 10 sales (a 10% conversion rate), the algorithm sees you as a highly profitable partner. It will push your listings to the top of the first page, giving you even more free traffic.
What is a Good Conversion Rate?
The average conversion rate for an Etsy print-on-demand shop is between 1% and 3%. If you are below 1%, you have a serious problem that needs immediate fixing. If you are above 3%, you have a winning product that you should scale immediately.
How to Fix a Low Conversion Rate
If people are clicking on your item but not buying, the traffic is not the problem. The presentation is the problem.
The most common reason for a low conversion rate is amateur product photography. If your t-shirt looks like a flat, digital sticker pasted onto a generic white background, buyers will not trust you. They will click the back button and buy from a competitor who looks like a real brand.
You do not need an expensive camera to fix this. You can use the ListyStyle mockup creator. This intelligent system places your designs into hyper-realistic, real-world lifestyle scenes. It turns a basic design into a highly desirable product photo that builds instant trust. Professional visuals can increase your conversion rate dramatically. For more tips on visuals, check out our guide on Etsy Product Photography in 2026: The Complete Guide to High-Converting Images.
Mastering the New Etsy Search Visibility Dashboard
Etsy recently introduced the Search Visibility page (often found under the Search Analytics section). This is a massive upgrade for sellers who want to understand exactly how they perform in search results.
This dashboard introduces two vital concepts: Impressions and Click-Through Rate (CTR).
Impressions
An Impression means your product appeared on a buyer's screen during a search. They did not necessarily click it; they just saw it as they scrolled past.
High impressions mean your SEO is working. Your tags and titles match what people are searching for.
Click-Through Rate (CTR)
CTR is the percentage of people who saw your item (Impressions) and actually clicked on it (Visits).
If your item has 10,000 impressions but only 10 clicks, your CTR is 0.1%. This is a massive red flag. It tells you that while your SEO is getting you on the page, your main image or your price is turning people away. The buyer saw your product next to your competitor's product, and they chose the competitor.
If you have high impressions and low clicks, do not touch your tags. Change your main photo immediately.
Identifying Top-Performing Listings to Multiply Your Success
At the bottom of your Stats page, you will see a list of your individual items. You can sort this list by Views, Favorites, or Revenue.
Many sellers make the mistake of spending 80% of their time trying to fix their worst-performing listings. This is a waste of energy. You should spend 80% of your time multiplying your best-performing listings.
Sort your items by Revenue for the last 90 days. Find your top three products. These are your "Star Products." The market has already spoken and told you they love these designs.
Now, your job is to create variations. If your best seller is a "Retro Cat Mom" coffee mug, you should immediately create a "Retro Dog Mom" mug, a "Retro Plant Mom" mug, and put that original cat design on a tote bag and a hoodie.
Doing this manually takes hours. But with Listybox's intelligent automation system customized for Etsy sellers, you can move at lightning speed. You can use our The 2026 Etsy Print on Demand Niche Research Guide to find the next logical spin-off, and then use our Creation Wizard to apply your winning design to 50 new products in under five minutes.
The Etsy Analytics Action Schema: What to Do When Metrics Change
Reading data is only half the battle. The real power comes from knowing exactly what action to take when a metric moves.
Here is your clear, step-by-step action schema. Bookmark this section and return to it whenever your shop performance changes.
Scenario A: Low Impressions, Low Visits
The Problem: You are invisible. You are not even showing up in the search results.
The Cause: Poor SEO, highly saturated niches, or a new shop with no established trust.
The Action:
Step 1: Stop making new designs for a moment and focus on research.
Step 2: Update your titles and tags using long-tail keywords (e.g., "minimalist gold cat necklace" instead of just "cat necklace").
Step 3: Run your listings through the Listybox SEO engine to ensure you are targeting terms buyers actually use.
Scenario B: High Impressions, Low Visits (Low CTR)
The Problem: You are on the search page, but buyers are scrolling right past you.
The Cause: Your main thumbnail image is boring, your price is too high compared to neighbors, or your title does not match the image.
The Action:
Step 1: Check the search page for your main keyword. Look at the top 10 results. What do their photos have that yours lack?
Step 2: Generate brand new, high-quality lifestyle mockups for your main image.
Step 3: Test a small price drop or offer a "Free Shipping" guarantee to make your listing more clickable.
Scenario C: High Visits, Low Orders (Low Conversion Rate)
The Problem: People are walking into your store, looking around, and leaving empty-handed.
The Cause: Lack of trust, missing information, confusing variations, or high shipping costs revealed at checkout.
The Action:
Step 1: Fill all 10 photo slots. Include a size chart, a color chart, and a close-up of the design details.
Step 2: Rewrite your product description to answer common questions before they are asked (shipping times, material quality).
Step 3: Check your shipping profiles. If shipping costs more than the item itself, buyers will abandon their carts.
Never change everything at once. If you have low conversion, change ONLY the photos, wait a week, and check the data. If you change photos, tags, and price all on the same day, you will never know which change actually worked.
Scenario D: High One-Time Sales, Low Repeat Customers
The Problem: You are making money, but you are constantly hunting for new buyers. Your business is not building loyalty.
The Cause: Unmemorable packaging, slow shipping times, or a lack of cohesive brand identity.
The Action:
Step 1: Ensure your print-on-demand partner is delivering high-quality goods rapidly.
Step 2: Add a custom packing slip with a thank-you note and a 10% off coupon code for their next purchase.
Step 3: Build a cohesive product line so a buyer who bought a shirt today will want the matching hat tomorrow.
Stop Guessing and Start Growing
Understanding your Etsy Shop Stats is the line that separates hobbyists from true business owners. When you know the difference between a view and a visit, when you track your conversion rates religiously, and when you follow a strict action schema, the mystery of Etsy disappears. It becomes a predictable, manageable machine.
But knowing what to do is different from having the time to do it. If your data tells you that you need to optimize 200 listings for better SEO, or create 500 new lifestyle mockups to fix a low conversion rate, doing that manually could take weeks.
That is where intelligent automation steps in. You can interpret the data, and let technology execute the heavy lifting. start Listybox now - no credit card required and turn your analytics insights into instant action.
Does all of this feel overwhelming? You don't have to start from scratch. With Learn more about Store Setup, our expert team sets up your Etsy store, lists your first 10 products, and optimizes everything for SEO. This service is included FREE with annual Starter and Professional plans! Stay informed, read the official guidelines on Etsy's official seller handbook, and take control of your shop's future today.
Never Miss an Update
Get actionable Etsy tips delivered to your inbox every week. No spam, unsubscribe anytime.